Use the best market tools for your trading!
Make sure your trading is perfect in every way, not just your skills but the tools you use for high-precision analysis of the market situation. It’s pretty obvious that if your information is coming from unreliable sources or lagging, you will lose money. You can’t afford to rely on incorrect data. That is why the market analysis software you use must be properly configured and prepared for specific tasks.
How to set up the VolFix platform and make most of it?
If this is your first time you are using Volfix, here are some tips:
- all program modules can be divided into 4 groups:
- “Charts” – all variations of displaying the market information in the form of quotes, clusters, profiles
- Statistics modules – structuring market information to do statistical research (tables)
- Trading modules
- Information – news, trader ratings, chat
When working with data, you will see the “Limits” filters in almost every window.
- after making changes to settings and charts, click the Apply button.

First of all, you need to configure the Market Watch” module – it consists of a tickers table sorted in a certain statistical order. To the right of the table is a chart for a selected ticker [activate it by clicking the Chart button on top of the red panel].
By default, all popular tickers are displayed, but you can delete this list and add the tickers that you need using “add ticker”.
Pay attention to *A:
- Setup – important global Volfix settings
- Window – navigation through active modules. This button is present in all modules.
*C – synchronize chartics modules with one another
Now that we’ve figured out Market Watch, let’s open charts.
To open any chart you want, go to the “Component” section in the top red panel of Market Watch. Next, select Charts and then select Bar Chart and Cluster Profile.
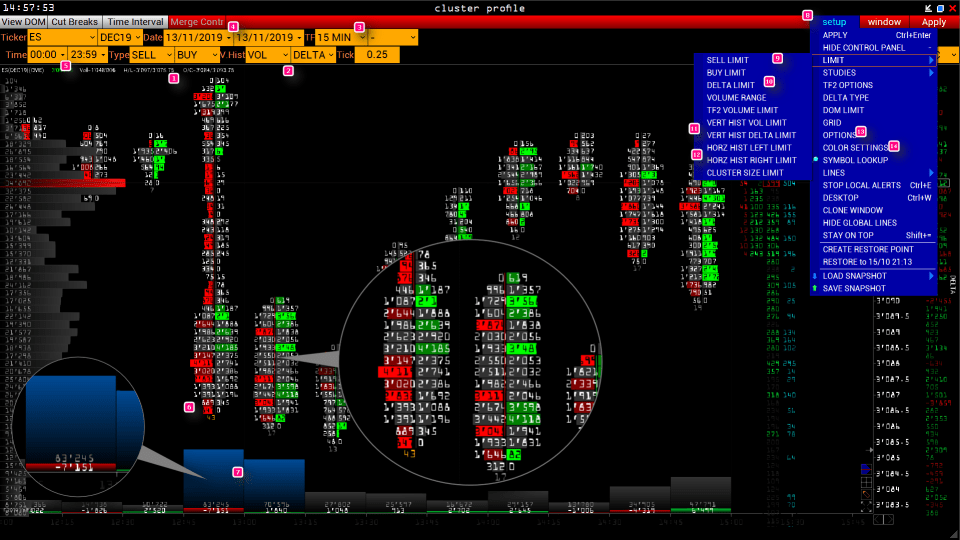
Cluster Profile is a chart based on price, volume, delta volume, and their combinations. In the upper part, you see the main chart settings. Ticker field * 5 – here we choose the ticker. A little lower – the time settings and the active contract. *4 – time period that the chart covers; *3 – choose main and additional time frame for your chart.
The most important volume parameters are * 1 and * 2
- type – how every bar is going to look like. E.g. in *6, two columns are displayed inside each profile. I recommend choosing “Volume” + Delta ”or“ Sell ”+“ Buy ”
- v.hist – the vertical volume type. See *7, choose from 2 histogram types.. I recommend “Volume” + Delta ”or“ Delta% ”.
The additional chart settings for each module are located in Setup (* 8) – here you can configure the font, color, lines and limits settings.
Volume limits – are necessary to highlight times and places on the chart where a certain volume was exceeded during a certain period of time. Set up different volumes for different time periods and choose the color for each of them. As a result, your chart will be colored with different color rectangles.
**9 and 10. – You can configure the delta or volume filter bid/ask for evert clusters
*11 – filter Total Volume and Delta% for the vertical volume histogram.
*12 – volume filters for the left and right horizontal histograms are available here.
Cluster Profile tips:
- Try using several instances of the Cluster Profile for each ticker, but choose a different data type display to cover as many options as possible;
- switch to other time frames to have a full market picture (e.g. use at least 3-time frames);
- do not set up too many filers as the chart will be a mess of colors and triangles. Only set up the filters that you really need.

Bar Chart
Has very similar settings as the Cluster Profile chart, but has less parameters to play with. The only button I always keep on is Merge Contract – you need this to stick the two consequent futures contracts together (e.g. if you are analysing a long period of market data).
*1 Price Hist + Volume Filter – this type of histogram is displayed in almost all chart modules. In the profile view, the total volume for each price for the selected period is displayed. Plus, you can filter the certain volume levels, as mentioned before.
*2 T.Hist is vertical volume histogram
*3 – volume statistics for the selected bar, e.g. see *4 to get it on the screen.
*5 – Choose how you want your bars to be displayed – click the Bar Type button in the upper left.
Bar chart recommendation: use the vwap indicator to see how the current price is relevant to the overall volume for the selected period.

Time & Sales module – a “stream” of data for every market trade. Here are the main columns of this module.
- trade volume
- bid / ask prices for a trade
- delta type – 2 delta types (Direct & Aggressor)
- trade time
- Market spread
- Volume filter -limit the lower minimum trade volume that you want to see in the Time & Sales
Recommendation Time & Sales: use 2-3 instances of this module with a different volume filter for each one.
Tick Bar Chart.

This chart is necessary for fine-tune volume filtering when working with separate ticks. The filters will make it easy to see where the large trades took place.
The picture above is displaying 2 charts at one – Euro and Franc futures (*6).
Once you have chosen your ticker(s), you will be able to configure the fields *2 and *3.
The chart displays each tick that the price has made, which makes it possible to filter the volume on the tick-by-tick basis and select abnormally large tick volumes. Just use Setup-Limits for this. Limits on the chart look like rectangles with the color you specified, e.g. for the chart above you’ll see orange rectangles for the Euro chart and purple rectangles for the Swiss Franc chart.
When using and additional ticker, please note that its price scale will be on the left of the chart.
*5 Try using a Draw tool (works for all chart modules) to draw lines, see Fibonacci retracements or make text notes right on the chart. To activate the Draw tool, simply click the pencil from the bottom right.


