Petroleum
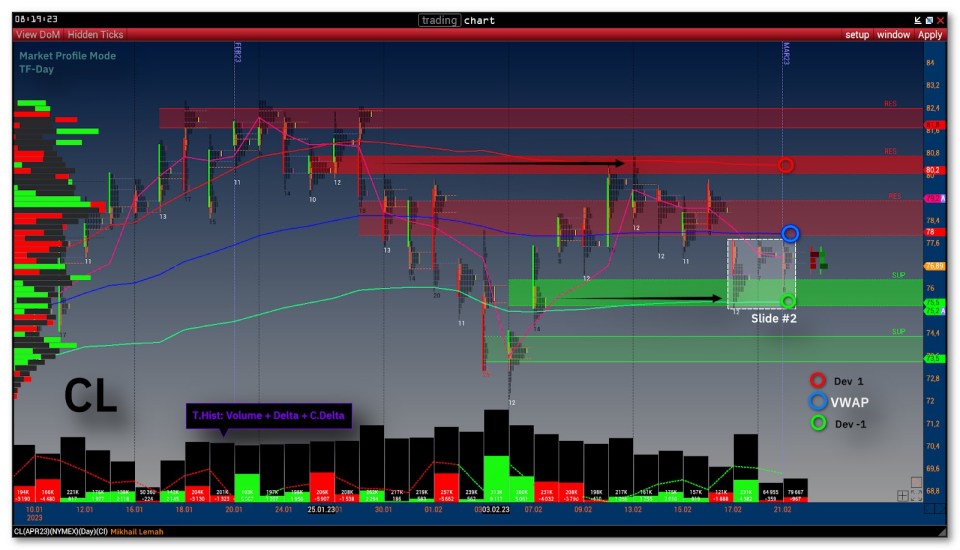
- CL TF: Day
- Chart: market profile – range day – open/close
- Indicator VWAP + dev1/dev-1
- Total Histogram (price/tf) Volume/Delta
The specification and volatility of the CL futures contract is what led me to speculate on black gold. I won’t be trading CL this week and there are several reasons for that.
Volatility is probably the most important thing about CL. Making good profits without waiting days for the required target is what’s stopping me from leaving the oil trading clan.
The VWAP channel is already pointing to a narrowing of volatility and for good reason. This week is a holiday in the USA, Saudi Arabia and towards the end of the week Japan celebrates the birth of the Emperor.
The support and resistance levels and the boundaries of the 1st deviation channel of the VWAP indicator coincide. This is worth taking into account in your strategies.
The dynamics will recover immediately after the holidays, and until the return of liquidity in the oil market, we may stand in the same range.
You noticed the square that says Slide#2.
Now for the tick chart on the second slide.
On the tick chart you can notice circles and rectangles in red and green.
The colour is simple: filters and information in green are about buyer activity and imbalances, while red shows everything about sellers.
Big Trades – circles on the tick chart represent large trades + their buyer/seller side.
Volume bid/ask imbalances are shown as rectangles on the chart.
Note how clearly the activity of buyers is highlighted. Thus it is possible to determine the support and resistance levels.
If you have any questions, feel free to contact me.

Author / trader Mikhail Lemah
If you have any questions: [email protected]
You May Also Like

3 upcoming daytime Contests. Terms and registration

Friday the 13th
